 ‹ All Blogs
How to Build a Business Case for Replacing Your Credit Union's Legacy LOS
Most business cases for replacing a legacy LOS fail at the board level for the s...
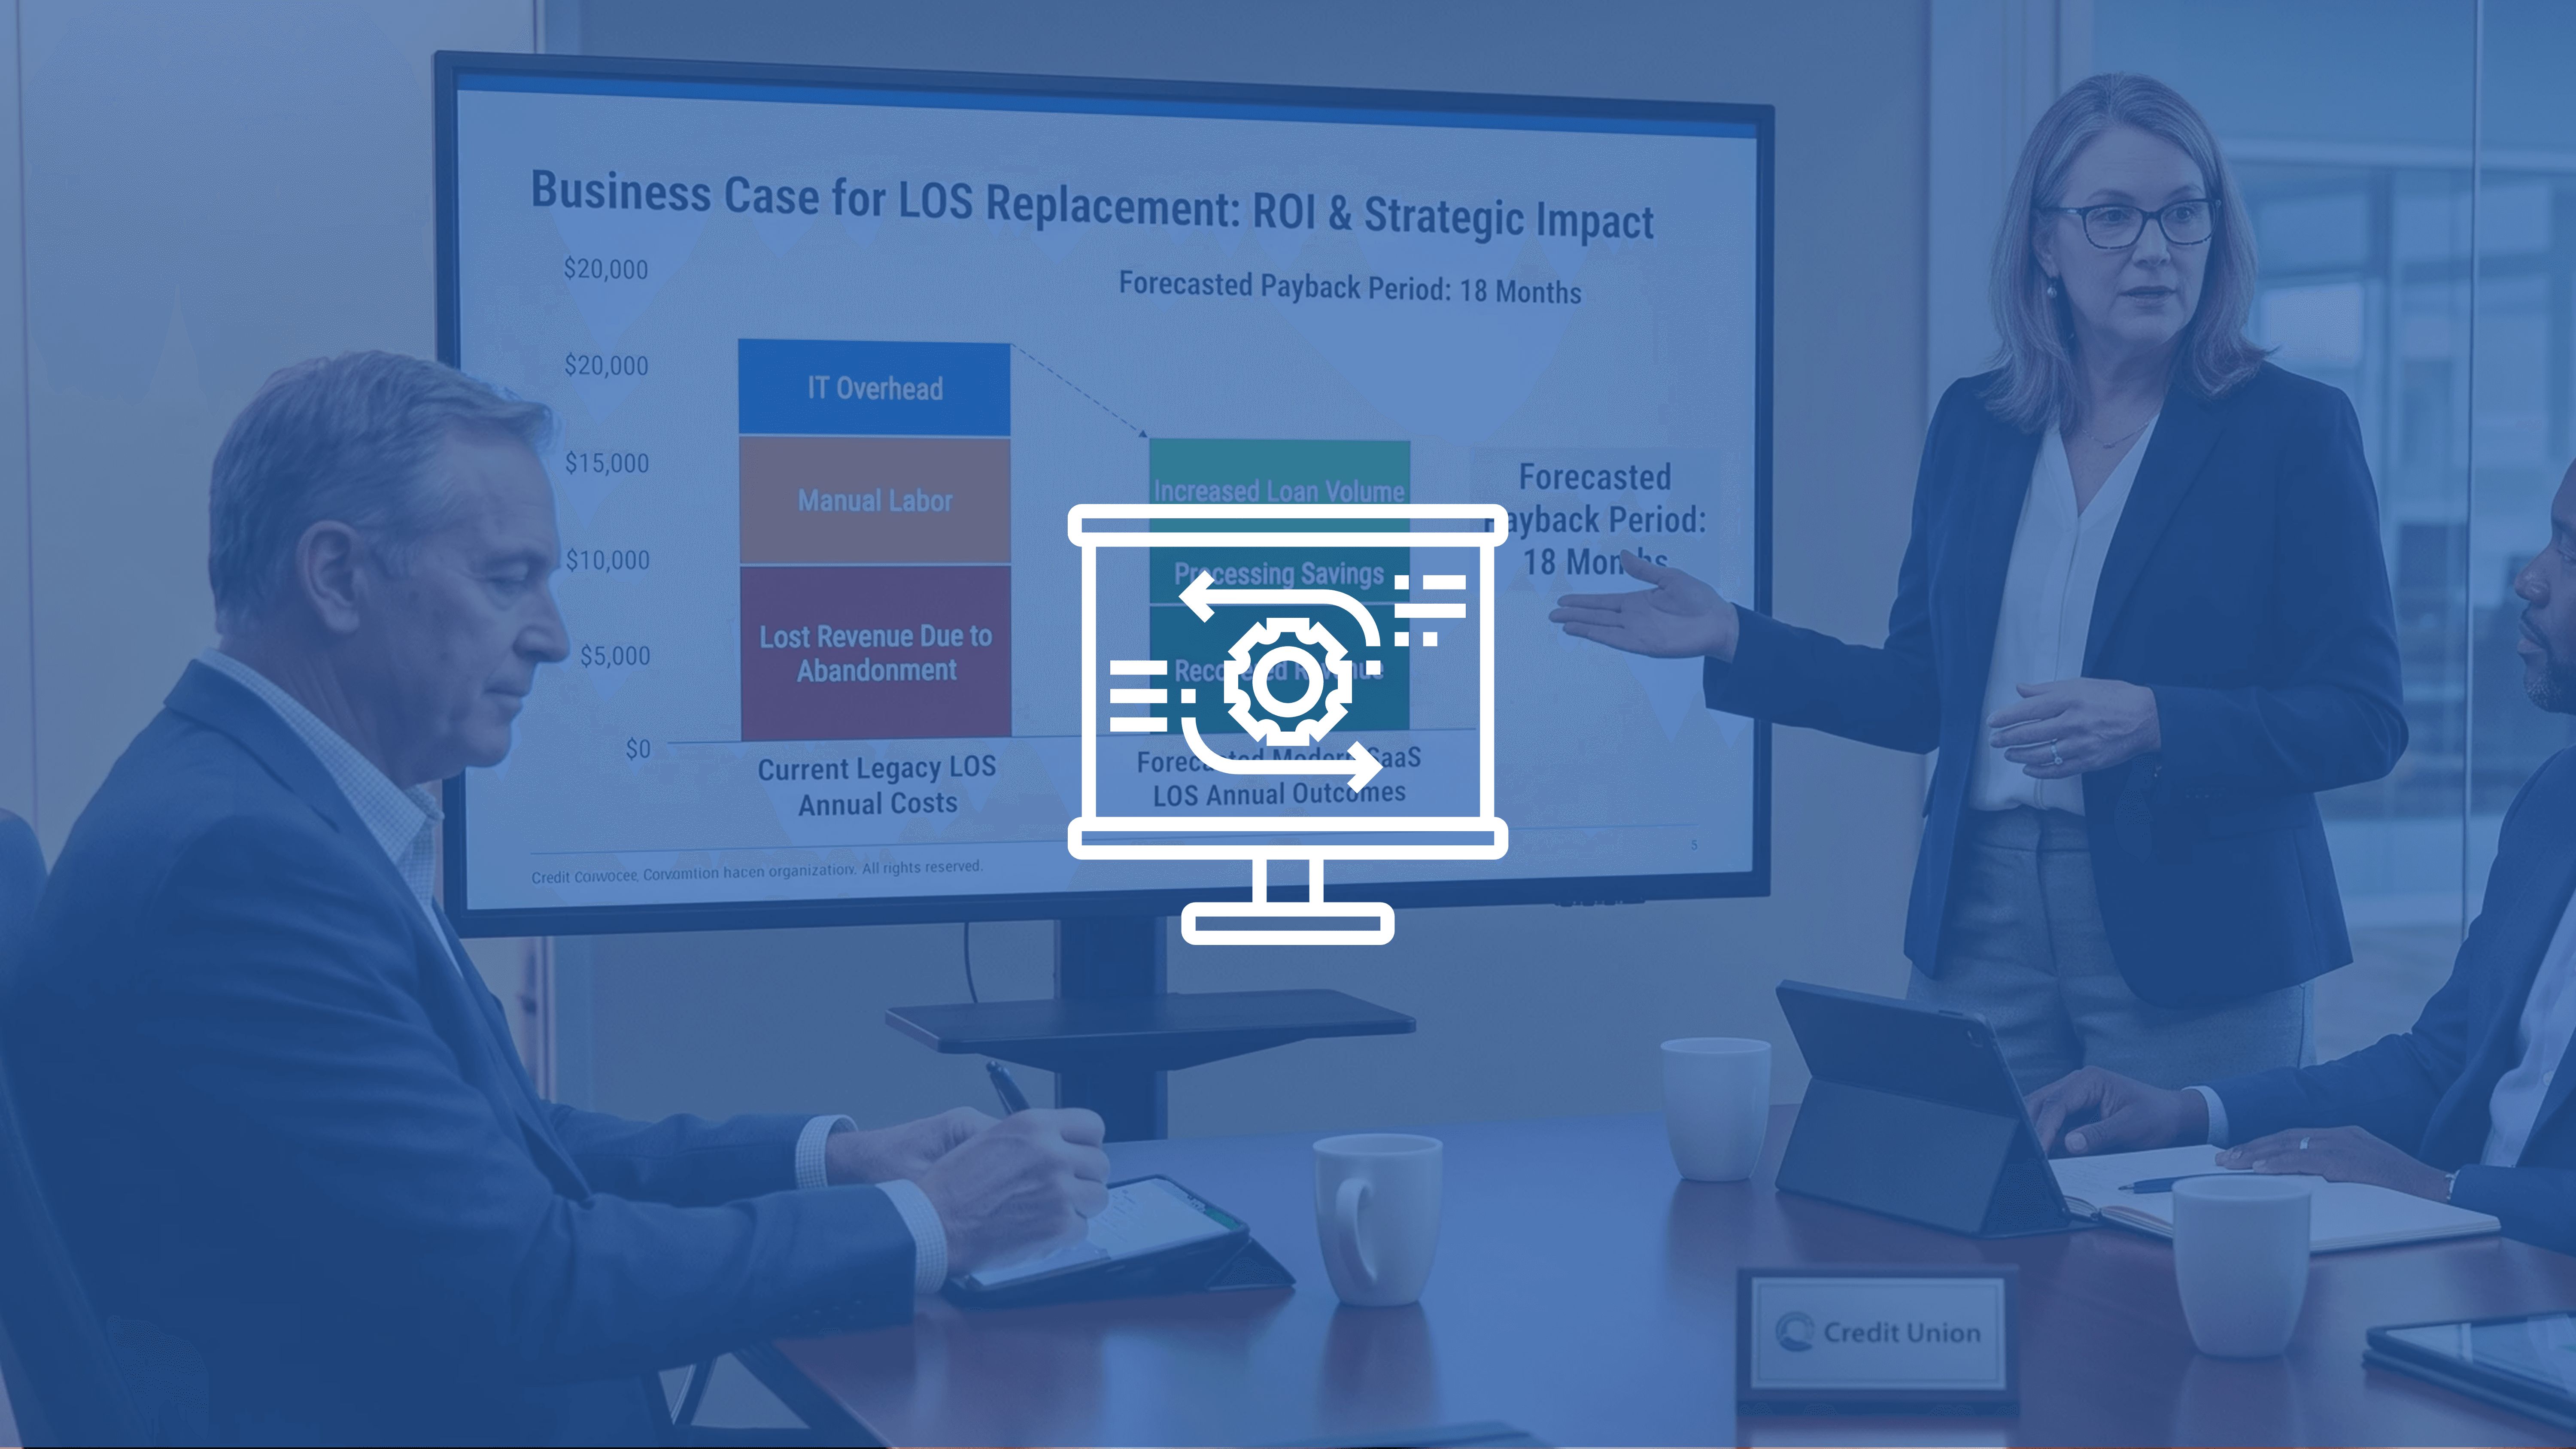
The Board Does Not Buy Technology. It Buys Outcomes.
Most business cases for replacing a legacy LOS fail at the board level for the same reason. They lead with features. They describe what the new platform does - AI decisioning, omnichannel application intake, no-code policy configuration - and ask the board to approve a technology investment based on capability descriptions.
Boards do not approve technology investments. They approve outcome investments. The question is never "does this platform have AI?" The question is "what does this investment do to our loan volume, our member retention, our per-loan cost, and our regulatory risk - and how do we know?"
The CFO will model the numbers. The board will evaluate whether the numbers are credible, whether the risk has been managed, and whether the leadership team asking for the approval has done the work to know what they're talking about. A business case that cannot answer those questions will not get approved - and should not.
This guide is structured as a working framework for CFOs, CEOs, and COOs who are building a board-ready business case for LOS replacement. It covers how to quantify the cost of the current system, how to build the revenue and risk case for modernization, how to structure the financial model, and how to present it in a way that answers the board's actual questions.
Step 1: Quantify the True Cost of Your Current System
This is where most business cases fail to do the work. They compare the legacy vendor invoice against the new platform's licensing fee. That comparison almost always makes the legacy system look cheaper - because the invoice is the smallest component of what the legacy system costs.
The full cost of a legacy LOS has six categories. Most credit unions can only see the first one clearly. The business case has to reconstruct the others.
The annual licensing or maintenance fee paid to the current LOS vendor. This is the number everyone knows. It is not the number that matters.
How much IT staff time is consumed by the legacy LOS? Integration maintenance - keeping the LOS-to-core connection functional as both systems update - is the largest hidden IT cost. Custom API builds require engineering attention every time either connected system releases an update. For credit unions on Jack Henry Symitar or Corelation KeyStone, each major core update is a potential integration break that requires IT response.
How to calculate it: Ask your IT team how many hours per month are spent on LOS-related integration maintenance, issue resolution, and workaround management. Multiply by fully-loaded hourly cost. An honest accounting of IT overhead typically adds 30–80% to the visible vendor fee.
Every material regulatory change - a new CFPB circular on AI adverse action, an NCUA supervisory update on model governance, a state law change affecting disclosure requirements - requires a development sprint in a legacy LOS. These sprints are typically $15,000–$80,000 per cycle. There are multiple material compliance changes per year.
How to calculate it: Review IT billing or staff time records for the last two years and identify compliance-related development costs. If compliance updates are handled through staff time rather than vendor billing, estimate hours × cost. This category is often $80,000–$200,000 annually at mid-size credit unions without anyone tracking it explicitly.
Every manual step in the legacy LOS workflow - re-keying data between systems, manually ordering bureau reports, downloading documents and re-uploading them, reconciling LOS pipeline reports against the core - is staff time with a real cost. This cost is buried in lending operations headcount and almost never attributed to the LOS.
How to calculate it: Map the manual steps in your current origination workflow for each loan product. Count the average minutes per step, multiply by average application volume, and multiply by fully-loaded staff cost. This calculation almost always produces a larger number than the IT overhead estimate.
Lenders using modern LOS platforms with embedded automation report AI-assisted document review, income verification, and decision support can cut processing time by 40–60%. That reduction is the baseline for quantifying what the manual overhead is costing now.
This is the largest number in most legacy LOS cost calculations - and the one most credit unions have never attempted to measure.
Application abandonment at 68% industry average means that for every 100 members who start a digital loan application, 68 do not submit it. Each abandoned application represents a loan that did not fund, interest income that was not earned, and a member who experienced friction and went somewhere else. At some legacy digital experiences, abandonment reaches 97%.
How to calculate it:
Step 1: Determine your digital application abandonment rate. (If you do not know it, that is the first number to get from your LOS reporting or analytics team.)
Step 2: Multiply your annual application starts by your abandonment rate to get the count of abandoned applications.
Step 3: Apply your average approval rate to the abandoned application count to estimate how many would have funded under a lower-abandonment experience.
Step 4: Multiply projected additional funded loans by average loan balance × net interest yield × average loan life.
Illustrative calculation for a $500M credit union:
- 8,000 digital consumer loan application starts annually
- 68% abandonment = 5,440 abandoned applications
- 45% approval rate applied to abandoned count = 2,448 applications that would have funded
- Assume 20% recovery rate with modern LOS (conservative) = 490 additional funded loans
- At $18,000 average balance, 5% net yield, 2.5-year average life = approximately $1.1M in recoverable net interest income annually
This is not a projection of what a new LOS will definitely deliver. It is a framework for quantifying the current loss - the revenue the institution is not capturing because its technology is creating friction. The board needs to see this number before it can evaluate the investment required to recover it.
NCUA examination findings related to adverse action notices, HMDA data errors, or AI governance failures generate remediation costs that can exceed several years of platform operating costs combined. A compliance consent order at a mid-size credit union typically costs $500,000–$2,000,000 in remediation and staff time - plus the reputational and regulatory relationship costs that are harder to quantify.
How to model it: Identify any examination findings from the last 24 months related to lending compliance. Estimate the probability of a similar finding in the next examination cycle given the current LOS's adverse action architecture. Assign a conservative remediation cost estimate. This produces an expected compliance risk cost that belongs in the total cost of the current system.
Step 2: Build the Revenue Case for Modernization
The cost of the status quo is the first half of the business case. The revenue opportunity from modernization is the second - and it is the half the board will scrutinize most carefully, because it requires assumptions about future performance rather than historical costs.
Build the revenue case from three independent opportunity categories. Present them separately. Let the board evaluate each one independently.
Using the calculation above, project the loan volume recoverable from improving the digital application experience. Be conservative - use a 15–20% abandonment reduction rather than the top-of-market claims. Present the calculation methodology clearly, so the board can adjust the assumptions.
A useful anchor: credit unions replacing legacy digital LOS platforms have reported new membership volume 10%+ higher than their previous best year, and instant approvals increasing by over 25% from the previous system. Present these as external benchmarks, not as promises for your institution.
For credit unions with dealer channel lending, calculate the revenue impact of improving look-to-book ratios through real-time decisioning.
Illustrative calculation:
- $50M annual indirect auto lending origination volume at 25% current look-to-book
- $50M × 25% = $12.5M in funded loans from the approval pipeline
- Modern LOS with real-time decisioning achieves 50% look-to-book (conservative; some credit unions report 60–75%)
- $50M × 50% = $25M funded - doubling funded volume from the same approval pipeline
- Incremental $12.5M at 5% net yield over 3.5-year average life = approximately $2.2M additional net interest income annually
Look-to-book improvement from real-time decisioning is one of the most direct ROI calculations in LOS modernization - because the loans approved at 25% look-to-book were already being underwritten. The cost of underwriting those loans was already being incurred. The revenue improvement requires no additional underwriting work, only faster decision delivery.
For credit unions with thin-file or near-prime member segments, calculate the loan volume recoverable through better decisioning accuracy.
This calculation requires the most conservative approach because it requires assumptions about approval rates and default rates on a population the institution is currently not serving. Present it with explicit methodology and conservative assumptions.
AI decisioning models incorporating alternative data have demonstrated double-digit increases in approvals for specific segments without a corresponding increase in default rates. A mid-size credit union implementing AI underwriting optimized its loan decisioning in six weeks, identified $2B in additional safe loan volume, and achieved a reduction in portfolio default rate from 1.90% to 1.54%. For a smaller credit union, the proportional impact is smaller - but the directional evidence is strong.
Step 3: Quantify the Risk Cost
This is the section that CFOs and general counsels need to see - and that most business cases underpresent.
The regulatory risk profile of a legacy LOS that cannot produce AI-compliant adverse action notices is not hypothetical. The CFPB's 2023 Supervisory Highlights specifically found compliance violations where adverse action reason codes from AI models did not accurately reflect the model's decision logic. The NCUA hired three AI officers for 2025–2026 explicitly to examine credit union AI governance practices.
For the business case, quantify the risk in two ways:
Examination finding probability: Based on the credit union's current adverse action architecture, what is the probability of a finding in the next examination? If the LOS generates adverse action notices from a post-hoc checklist rather than from AI model attribution, the probability of finding is non-trivial. A credit union with a finding history related to adverse action is compounding this risk.
Compliance remediation cost: Use actual remediation cost data from the institution's history, or benchmarks from NCUA enforcement actions. A compliance consent order costs - at minimum - the equivalent of five years of LOS licensing fees in staff time and remediation work. This is not a probability × cost exercise; it is a hard floor on what one finding costs.
The risk case stated directly: The legacy LOS's compliance architecture is creating a risk that has a real expected cost. Modernizing to a platform with embedded adverse action compliance reduces that expected cost. That reduction is a real financial benefit of the investment.
Step 4: Build the Investment Model
The investment side of the business case has two components: implementation costs and ongoing platform costs.
Implementation costs:
- Vendor implementation fees: typically 1–3× first year licensing, depending on complexity
- Internal staff time: calculate the hours dedicated to implementation across lending, compliance, IT, and operations, at fully-loaded cost. This is consistently underestimated. For a 4–6 month full-scope implementation, a 5-person internal team at 50% time dedication represents a real cost.
- Consulting or project management support if external resources are required
- Training costs for lending staff across all roles
Ongoing platform costs (5-year horizon):
- Annual licensing fees (get a fixed-rate commitment in the contract, not subject to annual escalation)
- Integration maintenance (near-zero for certified program integrations; confirm this in writing)
- Compliance update costs (should be zero on a vendor-maintained SaaS platform; confirm this in writing)
- Reduced IT overhead (calculate the IT time freed from integration maintenance and re-allocate to strategic projects)
The 5-year TCO comparison:
Build a side-by-side 5-year total cost model: legacy system vs. modern SaaS platform. Include all six cost categories from Step 1 on the legacy side. Include implementation plus ongoing platform costs on the modern side. The gap between these two numbers - which typically shows the legacy system costing 3–5× more than the SaaS alternative over five years when true costs are included - is the financial foundation of the business case.
Credit unions replacing legacy LOS platforms consistently report 38% lower per-loan processing costs. For a credit union originating 10,000 loans annually at $200 average per-loan processing cost, a 38% reduction is $760,000 in annual savings - which funds the entire platform cost and generates positive ROI within 18–24 months.
Step 5: Calculate the Payback Period
The payback period is the metric the board uses to assess risk. A business case with a 9-month payback period faces different scrutiny than one with a 36-month payback period.
Simple payback calculation:
Total investment (implementation + first year platform cost) ÷ Annual benefit (abandonment recovery + look-to-book improvement + processing cost reduction) = Payback period in months
Conservative scenario for a $500M credit union:
- Total investment: $800,000 (implementation $500K + year 1 platform $300K)
- Annual benefit: $1,400,000 ($1.1M abandonment recovery + $2.2M look-to-book × 25% confidence factor + $760K processing savings, conservatively weighted)
- Payback: approximately 7 months on the conservative benefit scenario
Present three scenarios: conservative (25% of projected revenue benefits achieved), base (50%), and optimistic (75%). Show the payback period for each. This demonstrates that even the conservative scenario generates a business case that passes the board's scrutiny threshold.
How to Present the Business Case to the Board
Structure the board presentation in six sections, each building on the previous:
1. The situation (3 minutes). Where we are: current system's operational gaps, the member experience we are delivering, and the competitive context. Use the signs from the previous blog in this series as the diagnostic frame. Boards respond to specifics - not "our LOS is outdated" but "our digital application abandonment rate is X%, costing us Y in loan volume annually."
2. The true cost of the status quo (5 minutes). Present the full cost model - not just the vendor invoice. Show the IT overhead, compliance sprint costs, manual labor, and abandonment revenue loss. This section reframes the cost of the legacy system from "what we pay" to "what it costs us." The board often does not know the full number, and seeing it clearly changes the conversation from "is this investment worthwhile?" to "why have we been absorbing this cost?"
3. The opportunity (5 minutes). Three revenue opportunity categories with conservative calculations and methodology. Show the assumptions explicitly. Boards trust business cases that show their work.
4. The risk case (3 minutes). Compliance risk quantified. Examination finding probability. Remediation cost floor. The board's fiduciary responsibility is to manage institutional risk - a compliance risk case connects the technology decision directly to that responsibility.
5. The investment and return (5 minutes). Five-year TCO comparison. Three-scenario payback period analysis. The metrics used to measure success after implementation - defined before go-live, not after.
6. The ask and the decision timeline (2 minutes). Specific approval request, vendor selection timeline, implementation start date, and go-live target. Boards approve decisions with clear timelines; they defer decisions that lack them.
Best Practices for LOS Implementation
Getting the board to approve the investment is step one. Executing the implementation successfully is step two - and the one where the business case's revenue projections either materialize or do not.
Start with the problems to be solved, not the features to be deployed. As Cornerstone Advisors notes, best practice institutions start LOS selection by identifying the ROI - defining the problems to be solved, the functionality needed to address those problems, and the metrics that will measure success. Many credit union LOS evaluations start with feature comparisons. Evaluations grounded in problem definitions produce better outcomes because they define success before vendor selection, not after.
Define success metrics before go-live. The business case established the metrics - abandonment rate, look-to-book ratio, per-loan processing cost, compliance finding rate. These become the implementation success criteria. Measure them at 90 days, 180 days, and 12 months post-go-live. The board that approved the business case will ask whether the outcomes materialized.
Sandbox-first, parallel run required. Every implementation detail that is cut to meet a compressed timeline will be discovered in production - at real member expense. The sandbox period is where integration errors are found before they create wrong first-payment dates. The parallel run is where workflow gaps are found before they become member complaints. Do not compress these.
Dedicate staff to the implementation. The most consistent cause of timeline overruns and outcome shortfalls is insufficient internal capacity. Build the implementation team into the budget before approval. Trying to manage a complex LOS implementation with staff who are simultaneously running full lending operations will extend timelines, reduce quality, and produce the outcome gaps that make the board's questions harder to answer at the 12-month review.
Compliance validation before production cutover. Have the compliance team review adverse action notice outputs, TILA calculation accuracy, and HMDA data capture before the system processes a single live member application. The business case's risk reduction claim depends on the new system's compliance architecture functioning correctly - validate that it does before going live.
Common Mistakes Credit Unions Make With LOS Business Cases
Mistake 1 - Presenting the invoice comparison. The single most common reason business cases for LOS replacement fail at the board level: the CFO presents vendor invoice vs. new platform license and the legacy system looks cheaper. The board approves staying with the legacy system. Six months later, the same conversations begin again. The business case that works presents total cost of ownership - all six categories - not the invoice.
Mistake 2 - Revenue projections without methodology. "We expect loan volume to increase by 20%" is not a business case. It is a hope. "Our abandonment rate is currently 68%; industry data shows modern platforms achieve below 35% for existing members; we are projecting 15% abandonment reduction which at our application volume and approval rate generates $X in additional funded loans" is a business case. Show the math.
Mistake 3 - Omitting the compliance risk cost. Business cases that present only the operational efficiency and revenue arguments leave the board with an incomplete picture of what the decision is about. The compliance risk cost of a legacy LOS with inadequate adverse action architecture is real, quantifiable, and material. Omitting it leaves a gap in the analysis that a risk-oriented board member will fill with skepticism about the whole proposal.
Mistake 4 - Proposing a vendor before the board has approved the investment. The board's decision is whether to invest in LOS modernization - not which vendor to select. Business cases that arrive with a vendor recommendation baked in conflate two distinct governance decisions. Present the investment case first. Present vendor selection as a subsequent decision with a defined process. This sequence is both better governance and more likely to generate board approval.
Mistake 5 - Not defining the implementation capacity requirement. If the business case does not include a realistic estimate of internal staff time required for the implementation - and a plan for how that capacity will be created - the board is approving a project whose execution plan has a known gap. Address implementation capacity explicitly in the proposal. "We will backfill the loan officer position to free capacity during the 5-month implementation period" is a plan. "Implementation will run parallel to current operations" is a problem.
Mistake 6 - Setting unrealistic timelines. A business case that projects go-live in 60 days for a full-scope LOS replacement is either incomplete in scope or overconfident in execution. Conservative timeline assumptions - 4–6 months for a full-scope consumer LOS implementation - are more credible to a board that has watched technology projects exceed estimates than aggressive ones. Under-promise and over-deliver wins more future budget flexibility than promising the moon.
What ROI Should CFOs Actually Expect?
Not a single number. A cascade of improvements across multiple metrics, materializing at different timescales.
Months 1–6 (operational efficiency, fastest to materialize): Per-loan processing time reduction as manual workflows are automated. Loan officer hours per loan declining as document AI and automated verification eliminate review queues. IT hours freed from integration maintenance. Initial abandonment rate improvement visible in digital channel analytics.
Months 6–18 (revenue recovery, primary impact period): Look-to-book improvement in dealer channels. Abandonment reduction translating to funded loan volume increase. Near-prime approval rate improvement as AI decisioning accuracy improves on thin-file members. Compliance finding rate declining as automated adverse action architecture replaces manual processes.
Months 18–36 (portfolio and strategic impact): Delinquency rate improvement from better risk stratification. Member satisfaction improvement from faster decisions and frictionless applications. New loan product launches that were previously delayed by LOS constraints. Staff retention improvement from higher-quality tools and reduced manual workload.
Credit unions that have executed well-planned LOS replacements consistently report performance improvements across all these dimensions. The business case that sets these expectations honestly - with conservative numbers and realistic timelines - is the one the board can evaluate rigorously and trust when the results arrive.
How Algebrik One Is Positioned for This Business Case
Every financial benefit category in this business case is directly addressed by Algebrik One's architecture.
Abandonment reduction: Algebrik's pre-fill from core data (Jack Henry VIP integration for Symitar, certified KeyStone integration), omnichannel POS with cross-channel continuity, and real-time AI decisioning address the three primary abandonment drivers simultaneously - form complexity, decisioning latency, and channel friction.
Look-to-book improvement: Real-time AI decisioning through Scienaptic AI signals, delivered in seconds, enables same-session approvals at the dealership. Open Lending Lenders Protection™ integration extends the approvable population into near-prime territory with insurance-backed coverage.
Processing cost reduction: Document AI, automated bureau pulls, automated income verification through Plaid, and validated core loan booking eliminate the manual steps that consume 40–60% of per-loan processing time at legacy LOS institutions.
Compliance risk reduction: ECOA adverse action notices generated from actual AI model attribution (SHAP-based, through Scienaptic AI). Carleton CarletonCalcs® for TILA accuracy. Complete immutable audit trail at every decisioning event. 100% NCUA audit pass rate across Scienaptic AI's 150+ credit union clients.
IT overhead reduction: Jack Henry VIP program certification and Corelation KeyStone certified integration means the maintenance burden sits with the program infrastructure, not the credit union's IT team.
The business case numbers in this guide are built from industry data - abandonment statistics, look-to-book benchmarks, processing cost research. Algebrik One's implementation evidence confirms these outcomes are achievable. We are happy to share reference conversations with credit unions that can validate them in production.
Frequently Asked Questions
How should a credit union build a business case to justify replacing its legacy loan origination system?
A board-ready LOS replacement business case has five components: the true cost of the status quo (six categories including vendor fees, IT overhead, compliance sprint costs, manual processing labor, abandonment revenue loss, and compliance risk); the revenue opportunity (abandonment recovery, look-to-book improvement, near-prime expansion); the risk cost (compliance remediation probability and cost floor); the five-year TCO comparison showing investment vs. full true cost; and a three-scenario payback period calculation. The business case that wins board approval connects technology investment to member growth,…
What best practices should credit unions follow for LOS implementation?
What ROI or measurable results can CFOs expect after replacing a legacy LOS?
What common mistakes should credit unions avoid with loan software business cases?
Ready to get started?
More Blogs

Blog
Computerized Loan Origination: How Technology Transformed Lending
Blog
Loan Origination System Requirements: A Checklist Before You Buy

Blog
Consumer Finance Systems: Why Unified Platforms Win Over Fragmented Stacks