 ‹ All Blogs
What the Latest Credit Union Lending Data Means for 2026
Picture a credit union CEO flipping through last year's results on a quiet Monda...

Picture a credit union CEO flipping through last year's results on a quiet Monday morning. Net income jumped 31.5% to $18.8 billion, the sharpest recovery since before COVID. Membership grew. Capital reached its strongest level in years. Time to celebrate, right?
Then they turn the page. Past due loans rose every single quarter of 2025, and by December total delinquency had crossed 100 basis points. Meanwhile, 124 institutions vanished from the industry in twelve months.
That tug of war sits at the heart of the latest credit union lending data for 2026, and it explains why so many lending teams feel confident and uneasy at the same time. Growth is real. So is the strain underneath it.
We lined up five quarters of NCUA call report data (Q1 2025 through Q1 2026) with our State of Lending Research (SOLR) survey of 40+ executives, and turned the whole thing into the State of AI in Lending Report, Credit Union Edition. This post walks through the biggest findings in plain English, explains what they mean for your 2026 plans, and finishes with a practical game plan you can begin this week.
Want every chart and survey breakdown within reach while you read? and keep it open in another tab.
In this post
- Where the numbers come from
- The 2025 snapshot: strong on paper
- Why delinquency rose every quarter
- The growth trap
- How fast members expect a decision
- Why smaller institutions are shrinking
- Where AI is showing up first
- What changes for loan officers
- Your 2026 game plan
- A quick self check
- FAQs
Fair question, and worth a minute before we get into the numbers. The report leans on two sources that we deliberately read side by side.
The first is NCUA quarterly call report filings covering all federally insured credit unions, from Q1 2025 through Q1 2026. That is the hard, regulatory side of the story: loans, delinquency, charge offs, capital and institution counts.
The second is our SOLR survey, where more than 40 executives from institutions of different sizes told us what they are planning, worrying about and struggling with. Treat it as a directional read on sentiment rather than a statistical sample of the whole industry.
Put the two together and you get something more useful than either one alone: what the numbers say is happening, and what the people running these shops are doing about it.
Four numbers set the scene:
- $18.8 Billion in full year net income, up 31.5%
- 4.6% loan growth by Q4, climbing from 3.3% in Q1
- 103 basis points of total delinquency in Q4, up from 80 at the start of the year
- 124 fewer federally insured institutions, dropping from 4,411 to 4,287
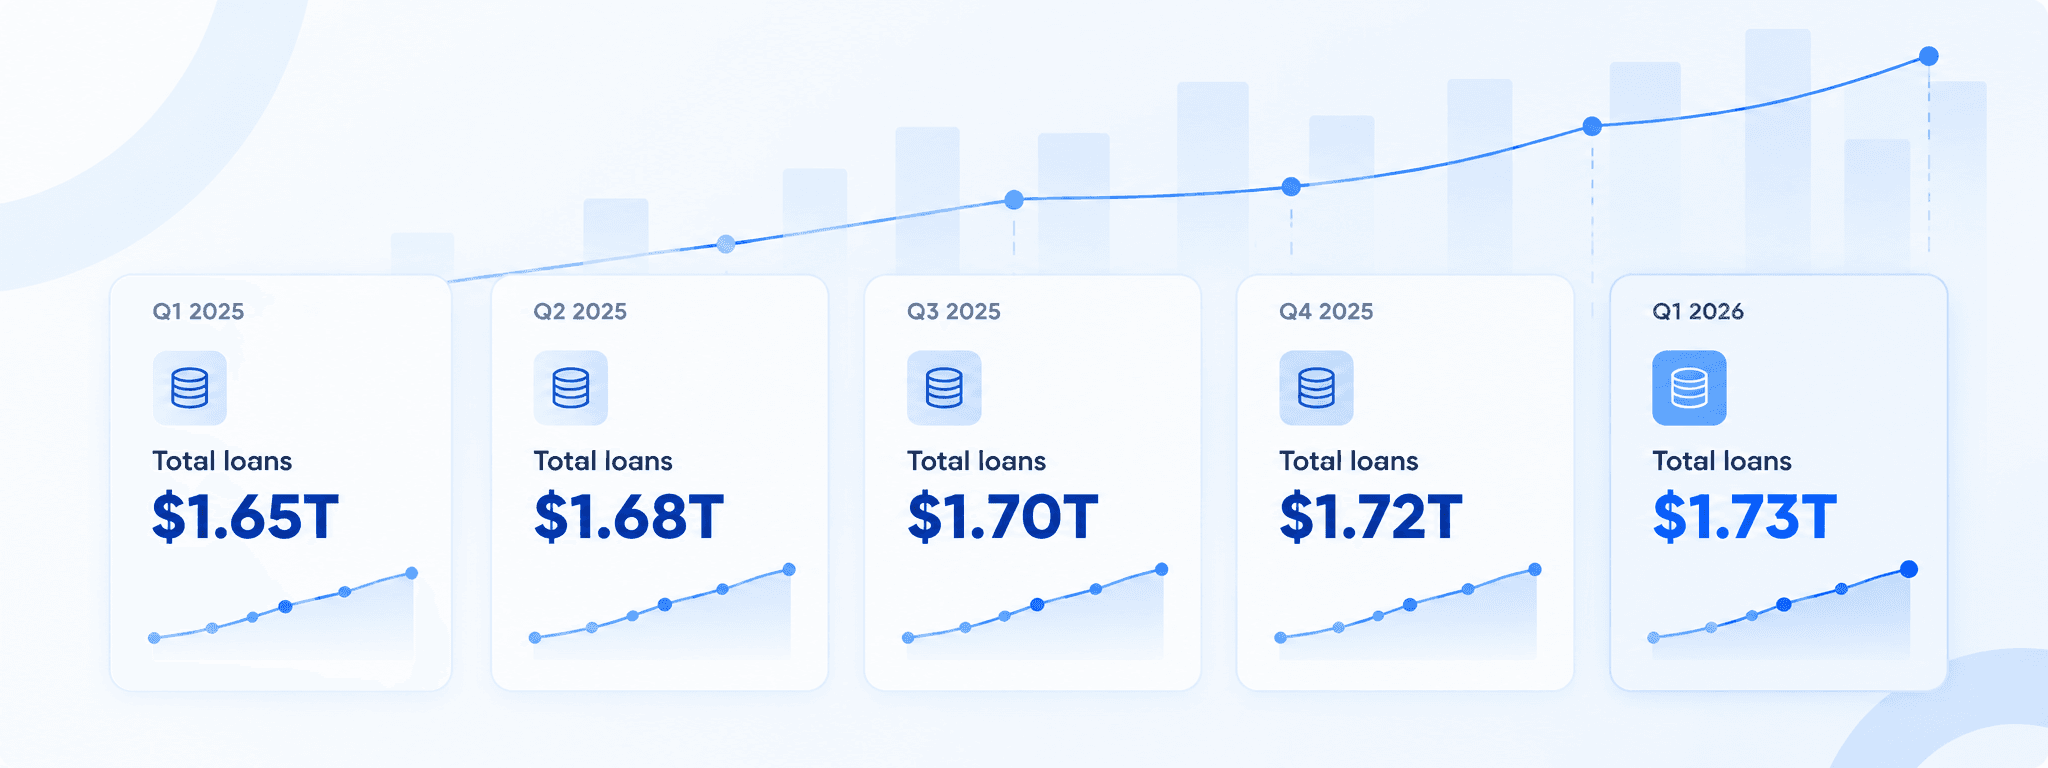
Now zoom out and look at all five quarters together.
Metric Q1 2025 Q2 2025 Q3 2025 Q4 2025 Q1 2026
Total loans $1.65T $1.68T $1.70T $1.72T $1.73T
Loan growth, 3.3% 3.9% 4.4% 4.6% 4.6%. year over year
Total delinquency 80 91 95 103 85 (basis points)
Net charge off ratio 82 79 77 78 81 (basis points)
Net worth ratio 10.95% 11.11% 11.24% 11.26%. 11.24%
Federally insured institutions 4,411 4,370 4,331 4,287 4,250
Source: NCUA quarterly call report summaries.
Read across the rows and a pattern jumps out. Loan growth sped up each quarter. Capital got stronger. Yet late payments climbed while the number of institutions kept falling. (Quick refresher if you need one: a basis point is one hundredth of a percent, so 100 basis points equals 1%.)
Money is coming in, borrowing is growing, and the sector is still getting smaller. So why the gap?
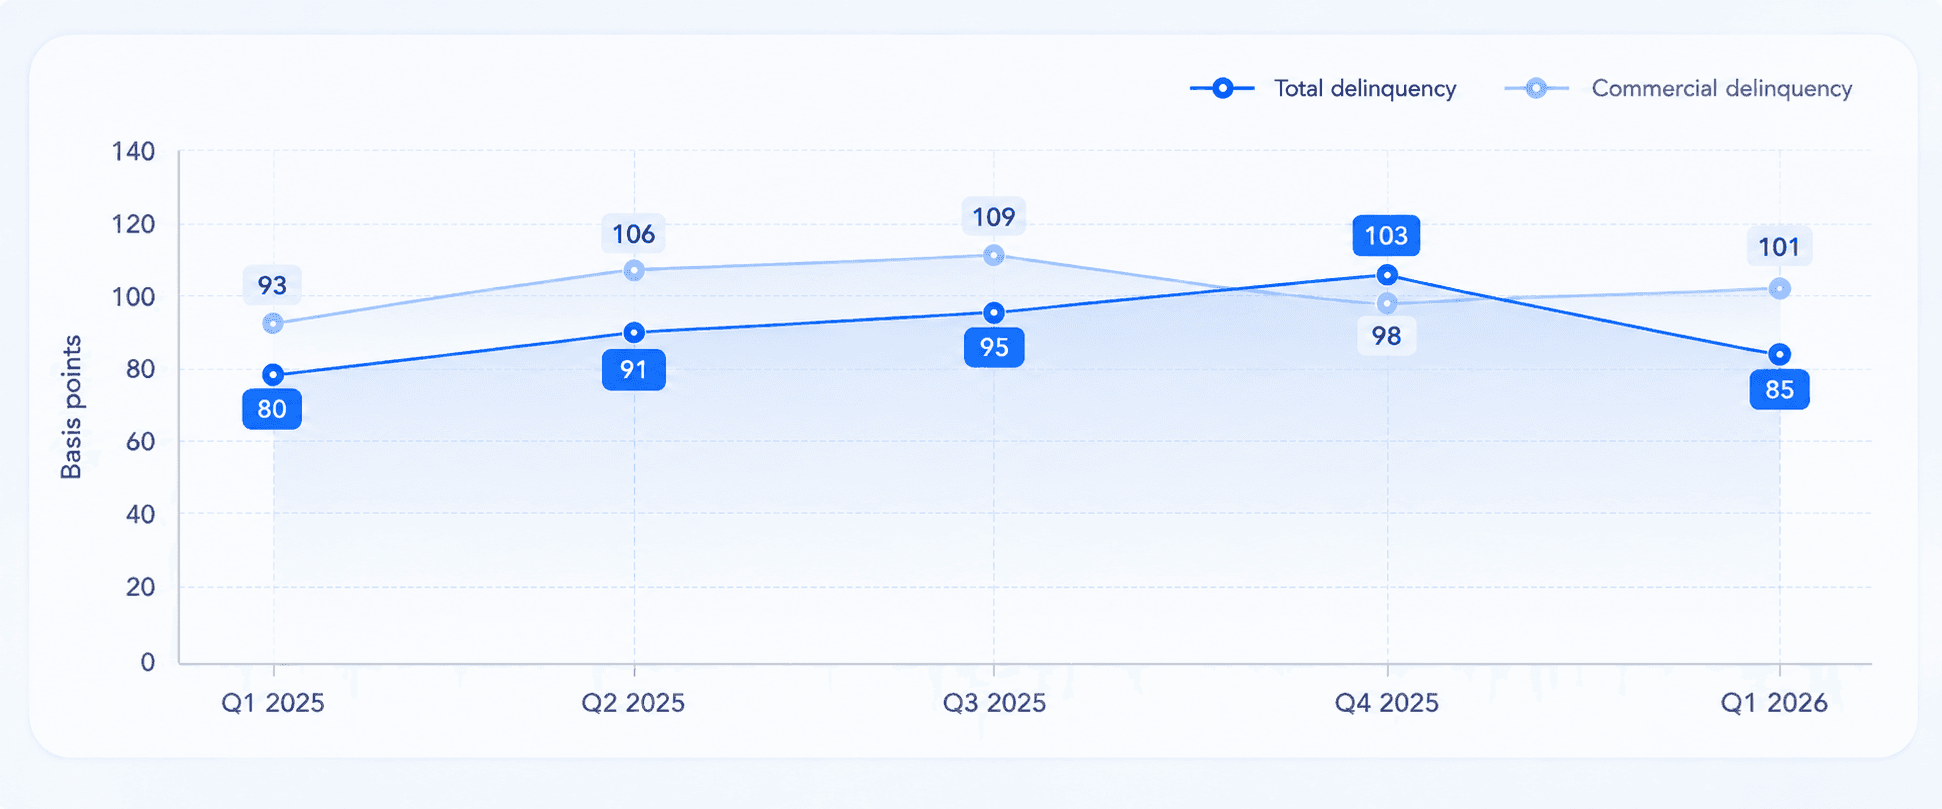
Because it built slowly, category by category, instead of spiking. Total delinquency went from 80 basis points in Q1 2025 to 91, then 95, then 103 by Q4. Q1 2026 brought a seasonal dip to 85, which feels like relief until you notice it remains 5 basis points above where 2025 began. All told, roughly $17.7 billion in loans sat past due at the end of 2025.
Here is how each loan category behaved:
Loan category Q1 2025 Q2 2025 Q3 2025 Q4 2025 Q1 2026
Total 80 91 95 103 85
Auto 80 82 87 96 80
Credit cards 201 193 204 215 204
Non commercial real estate 54 74 78 88 63
Commercial 93 106 109 98 101
Most categories followed the same script: a steady climb into Q4, then a seasonal breather. Auto loans went from 80 up to 96 and back to 80. Non commercial real estate rose from 54 to 88, then fell to 63. Cards ran hottest all along, peaking at 215.
Commercial loans are the odd one out, and they deserve their own spotlight. That book grew 10.9% year over year in Q4 2025 and now sits near $200 billion. Yet its delinquency slid from 109 in Q3 to 98 in Q4, then bounced back to 101 in Q1 2026, moving against the rest of the system. Fast growth plus an unsettled risk signal is the combination to watch as those loans season.
Net charge offs echo the same story. They eased for most of 2025, then ticked up to 81 basis points in Q1 2026. Translation: losses tied to earlier late payments are still working their way through the pipeline.
Three moves stand out. Revisit approval criteria for the segments drifting fastest, mainly auto and real estate. Flag 30 day late payments early so they never become charge offs. And stress test your commercial book as it matures.
There is also a neat pattern hiding in the survey. The biggest risk signal in the NCUA figures and the number one AI use case among executives are the same problem, since 63% are weighing AI for credit decisioning. Better decisions on the way in mean fewer loans going bad later.
Quick gut check: could you pull your 30 day delinquency rate for auto versus real estate in under a minute? If not, that's your homework this week.
Imagine a restaurant that decides to double its Saturday night covers without touching the kitchen. More tables, same stoves, same cooks. The first hour looks fantastic. By hour three, tickets are late, plates go out wrong and the crew is fried.
That, in a nutshell, is what our survey found in lending. 66% of surveyed institutions plan to grow loans by 5% or more in 2026, with 48% aiming for 5% to 12% and 18% aiming even higher. Yet 74% automate half or less of their origination workflow, and only about one in four has crossed the halfway mark. Ask executives their number one pain point and 45% say manual data entry.
Look at priorities and the mismatch gets sharper. Growing loan volume was named by 40% of respondents, while increasing automation was named by 38%. Almost as many people want more volume as want the tools to handle it. Improving member experience topped the list at 48%.
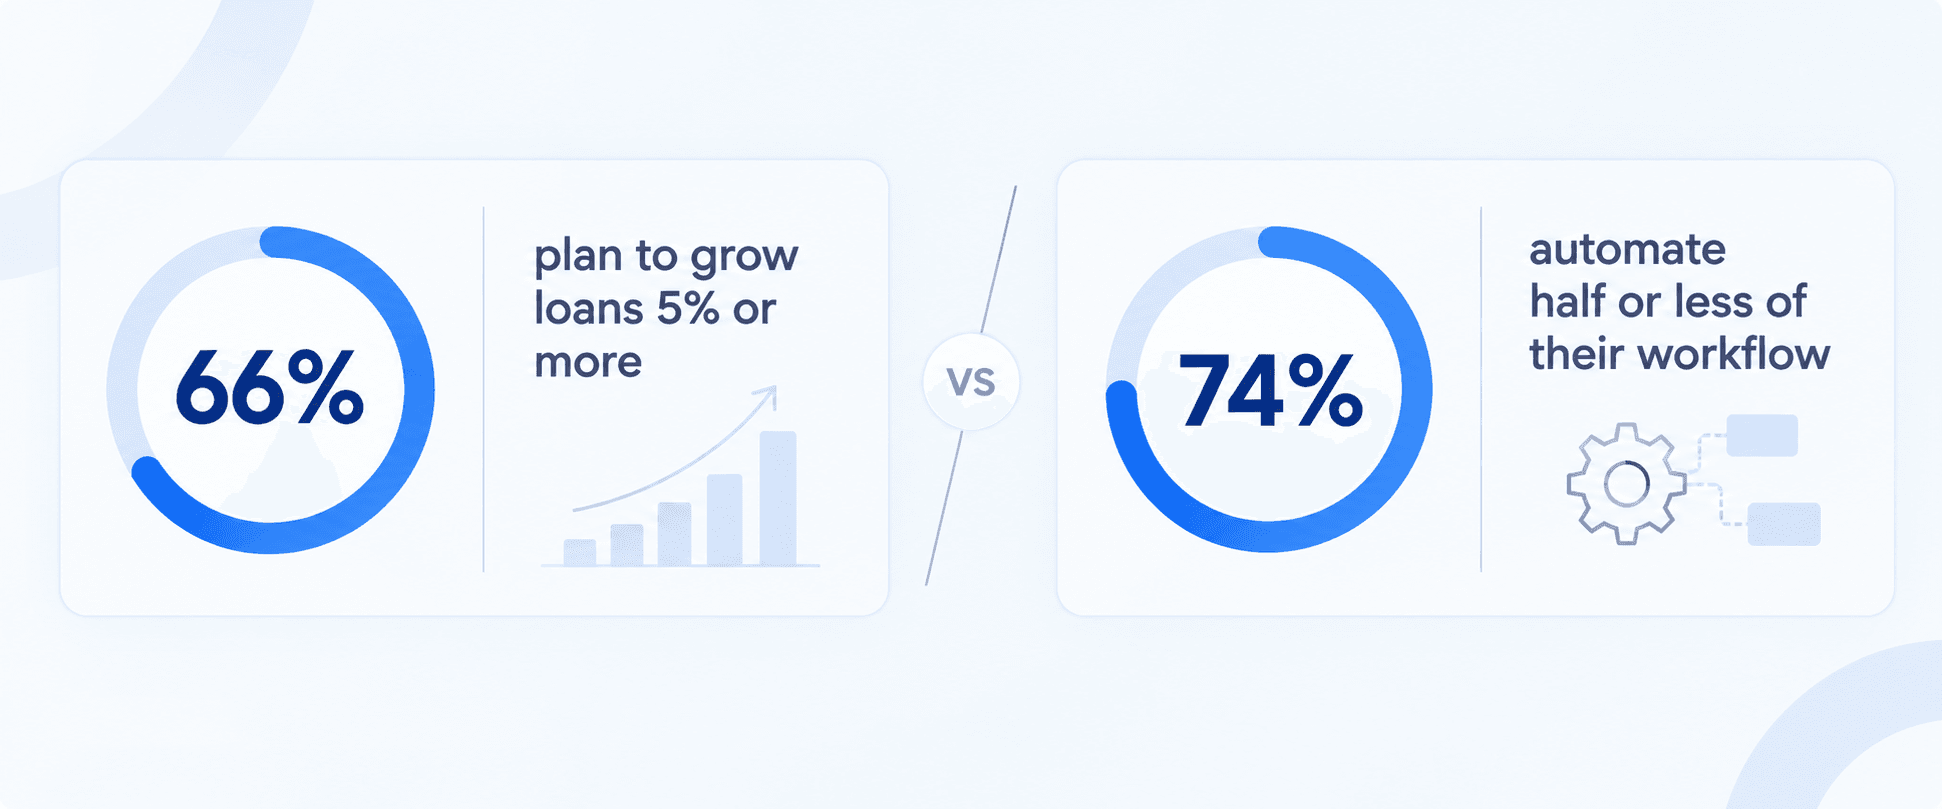
Why does it matter? Pushing extra volume through a manual process while late payments climb is like asking tired people to spot more risk in less time. Approvals made in a hurry with thinner review are often the first to go bad.
Ambition is fine. Trouble starts when growth targets and the machinery behind them stop matching.
Curious where your team lands? The SOLR report shows how peers rank on automation, AI plans and roadblocks.
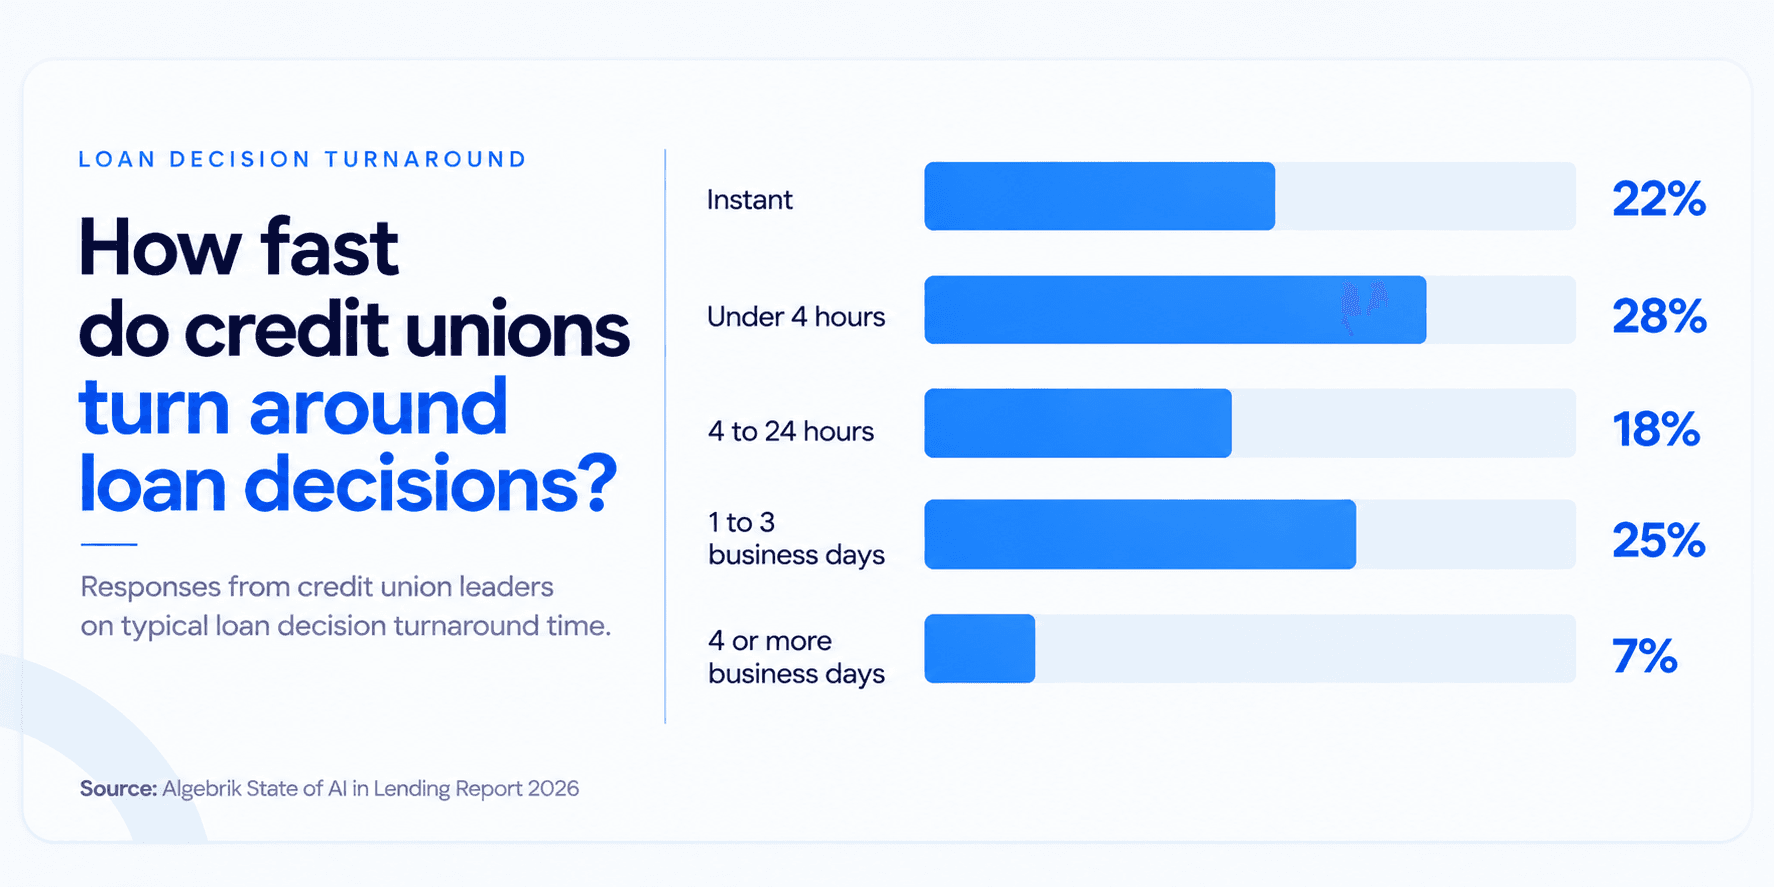
Faster than most shops deliver. We asked executives what turnaround they expect on anything other than a mortgage. 22% said instant, under 30 minutes, and another 28% said under four hours. That is half the room expecting answers before lunch. Stretch the window to same day and the figure hits 68%.
Meanwhile, 32% still measure decisions in business days, and 7% in four or more.
The stakes are rising too. The average outstanding balance was $19,397 at the end of 2025, up $984 in a year, and reached $19,557 by Q1 2026. Bigger balances mean each decision matters more to the borrower, and borrowers shop around. Slow answers cost goodwill. They also leave less time to price risk properly while late payments are climbing.
Today, members compare you with fintech apps and big banks, not the institution across town. Nobody expects each loan to fund in ten minutes. What people do notice is how long they wait to hear back at all. So measure time to first decision, not only final approval.
Keep it simple. Track turnaround by loan type. Look for delays between the application landing and someone opening it. And if straightforward loans take longer than 24 hours, treat that as a risk rather than an inconvenience.
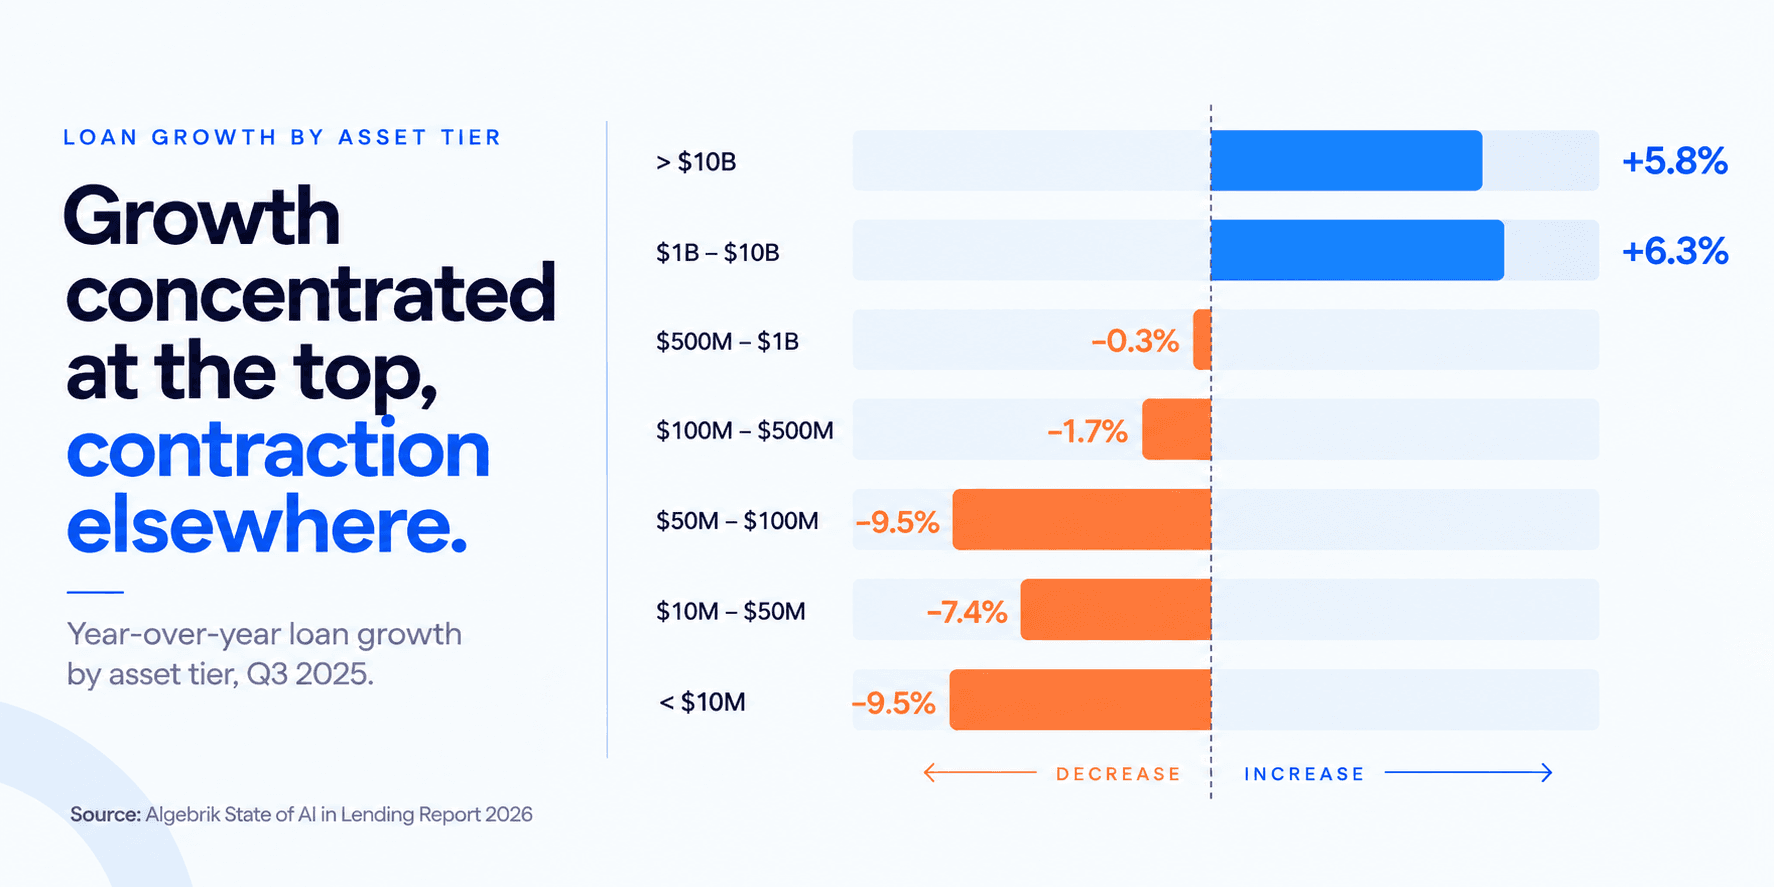
Consolidation is the quiet headline. The industry lost 124 institutions in 2025, mostly those under $500 million in assets, and the count slipped further to 4,250 by Q1 2026. Roughly 3,600 institutions sit below that $500 million line. About 740 sit above it.
Loan growth by asset size (Q3 2025, year over year) shows the divide clearly. Institutions above $1 billion grew loans by roughly 6%. Almost every tier below that slipped, and the three smallest tiers fell between 7% and 10%. Membership tells a similar story: the system grew from 144.7 million people at the end of 2025 to 145.8 million in Q1 2026, but smaller shops kept losing them.
Is technology the whole reason? No, though it is a big piece. In our survey, 57% called themselves early stage or not ready for AI (42% cite manual workflows, 15% cite legacy systems), and not one respondent said fully ready. Still, 96% have modernization plans in motion or on the table. Among them, 37% describe a major transformation, 30% an incremental path and 22% are still evaluating vendors.
Why are they moving? 78% point to member experience as the main driver, ahead of compliance and cost. Intent is high. Follow through is the gap.
Right where the pain is. Here is what surveyed executives said they are weighing, alongside the signal in the NCUA numbers that makes each one urgent:
- Credit decisioning and risk models (63%). Delinquency rose 23 basis points across 2025.
- Automated underwriting (59%). Most underwriting steps are still manual.
- Fraud prevention (52%). Rising delinquency tends to raise fraud exposure.
- Marketing and next best offer (41%). With 124 institutions lost, retention and cross sell matter.
- Generative AI for documents and service (41%). 45% name manual keying as their top pain point.
- Collections and loss mitigation (37%). About $17.7 billion in loans were past due at year end 2025.
Agentic AI is software that handles several steps of a task on its own, like collecting documents, verifying details and routing exceptions, without a person passing it along each time. It is the difference between a tool that answers a question and one that finishes a job.
Here is the eye opener: 21% of respondents already pilot it, and another 34% plan to begin within twelve months. Early movers are building know how that latecomers will need years to match. In our read, the fastest growing category, commercial loans, is exactly where autonomous decisioning has the most to offer.
Roadblocks are real, of course. 58% cite infrastructure that is not ready for AI, and 56% point to budget or unclear returns. Data fragmentation (41%) and governance or explainability worries (37%) round out the list. Data quality sits underneath all of it: only 12% call their data excellent, 38% call it good but in need of prep, and half rate it fair or poor.
These barriers feed each other. Scattered data produces shaky models, shaky models make returns hard to prove, unclear returns starve the budget, and no budget means the data stays scattered. The workable way out is starting small. Pick a high confidence use case, show results, then expand.
How you get there matters too. 42% of respondents prefer an AI native platform, compared with 35% who would rather layer AI onto existing systems. If credit decisioning is where you plan to begin, see how approaches it.
Want the full picture? The report breaks down each AI use case, barrier and readiness score from the survey. and compare it against your own roadmap.
Not their jobs. Their days. 73% of surveyed executives see loan officers moving toward exception handling and advisory work: 43% expect a focus on exceptions and relationship management, and 30% on advice and cross sell. Only 4% expect them to stay central to every decision.
Think about what that means for a smaller shop losing members. The institutions holding onto people are the ones building experiences where loan officers do relationship work instead of paperwork. With 45% naming manual entry as their biggest headache, the shift is welcome. Less keying, more conversations.
- Time your decisions. Measure turnaround by loan type, and focus on time to first decision, not just final approval. If you cannot state that number precisely today, that is the problem to solve
- Catch trouble early. Flag 30 day late payments fast, recalibrate approval criteria for auto and real estate, and stress test commercial loans as they mature.
- Run one or two real AI pilots. Credit decisioning and servicing are solid candidates. Skip another round of conference room talk, and do not wait for perfect systems. Start small and build.
- Clean and connect your records before scaling. AI cannot fix scattered records on its own, and those gaps will not close by themselves.
- Fix the two or three biggest bottlenecks. Go after high volume steps before edge cases, and track straight through processing rather than raw loan volume.
- Rewrite loan officer goals. Reward retention and resolution speed, not only application counts. Train teams to work with AI, not around it, and be upfront about how the role is changing.
Size changes the playbook. Under $500 million? Treat technology upgrades as a survival priority, lean on CUSO partnerships instead of building everything alone, and prioritize speed and digital experience. Above $1 billion? Begin scouting acquisition targets with compatible tech and member bases.
One more thing on timing: teams that act within the next 90 days are keeping pace with the curve. Teams that wait a year will spend it catching up.
Give yourself one point for each yes. (This checklist is ours, not a survey result, so treat it as a conversation starter.)
- Can you see time to first decision by loan type without asking anyone to build a special report?
- Do you flag 30 day late payments early instead of waiting for the next review cycle?
- Is more than half of your lending workflow automated?
- Is the data behind your loans clean and connected in one place you trust?
- Do you have at least one AI pilot running, or scoped with a launch date?
0 to 1 points: start with measurement. You cannot improve speed or risk you cannot see.
Here is the honest takeaway. 2025 was a strong financial year, and 2026 is asking tougher questions. Late payments crept up, growth goals outran workflows, and the distance between early movers and everyone else keeps widening. The numbers and the people running these institutions are pointing in one direction.
The good news is that none of this needs a grand overhaul to get going. Measure your speed, catch risk sooner, pick one pilot and tidy your data. Small, steady moves compound.
The full study goes deeper, with charts for all five quarters, delinquency by loan category, survey breakdowns and six action plans. Credit Union Edition and see how your numbers stack up.
If you'd rather see the platform than read about it, take the product tour, or check out how

Sources: NCUA quarterly call report summaries, Q1 2025 to Q1 2026; Algebrik SOLR survey of 40+ credit unions (directional insights, not a statistical sample of the industry).
Frequently Asked Questions
What is the current credit union delinquency rate?
The industry hit 103 basis points of total delinquency in Q4 2025, the peak of the five quarters tracked, then eased seasonally to 85 in Q1 2026. That remains 5 basis points above Q1 2025.
How fast did credit union loans grow in 2025?
Why are credit unions consolidating?
How many federally insured credit unions are there?
What is agentic AI in lending?
Which AI use cases are credit unions prioritizing?
What is the biggest barrier to AI adoption?
How fast do members expect loan decisions?
Ready to get started?
More Blogs

Blog
Computerized Loan Origination: How Technology Transformed Lending

Blog
Loan Origination System Requirements: A Checklist Before You Buy

Blog
Consumer Finance Systems: Why Unified Platforms Win Over Fragmented Stacks